How do I find what percentile a value is on a bell curve?
Subtract the average and divide by the standard deviation to get the z-score, how many standard deviations the value is from average. The bell curve turns that into a percentile. One standard deviation above average is about the 84th percentile, and two above is about the 98th.
- z-score (standard deviations from average)
- -2
- Percentile (share below)
- 2.28%
- Share above
- 97.7%
- As rare as (1 in …)
- 44
Challenge: Find a value in the top 0.1%, the 99.9th percentile or higher.
Play
Try a 6 ft 2 in man, then an IQ of 130. Then find the value that's exactly average.
Challenge: Find a value in the top 0.1%, the 99.9th percentile or higher. The box under the picture turns green when you get it.
Stuck? Pick one of the examples from the “Try an example” menu, or press “New example.”
Understand
Many measurements pile up around an average in a bell curve (the normal distribution). How far out you are is measured in standard deviations:
The shaded area to the left of your value is its percentile. About 68% of values fall within 1 standard deviation of the average, 95% within 2, and 99.7% within 3.
Use
Every input has a unit menu, so you can type values in the units you already have. Results follow your units.
Show the work
- z-score: how many standard deviations from the average
z = \frac{70 - 100}{15} = -2 - Percentile: the area under the bell curve to the left
\Phi(-2) = 2.275\% - The smaller tail, as “1 in N”
\frac{1}{0.02275} \approx 43.96
Export
Pick an example to fill in a real average and spread, then change your value.
- The example averages and spreads are rounded published figures. Real populations vary by country and year.
For learning and estimation. Verify with applicable codes, standards, and a qualified professional before using in design, construction, or safety-critical work.
Cheat card
| Symbol | Meaning | Unit |
|---|---|---|
| your value | ||
| mean (average) | ||
| standard deviation (typical spread) | ||
| area under the bell curve to the left |
- z = 0 is the 50th percentile, z = 1 is about the 84th, and z = 2 about the 98th.
- A negative z-score is below average.
- The curve is symmetric, so the top 5% starts at the same distance above average as the bottom 5% below.
Where it’s used
- Medicine & Health
Pediatricians use growth charts built from the bell curve to spot children far above or below average. - Biology
Heights, blood pressure, and many measurements cluster in a bell shape around the average. - Health & Fitness
Read a percentile on a test report or a baby’s weight chart and know what it means.
Related exhibits
 Start here
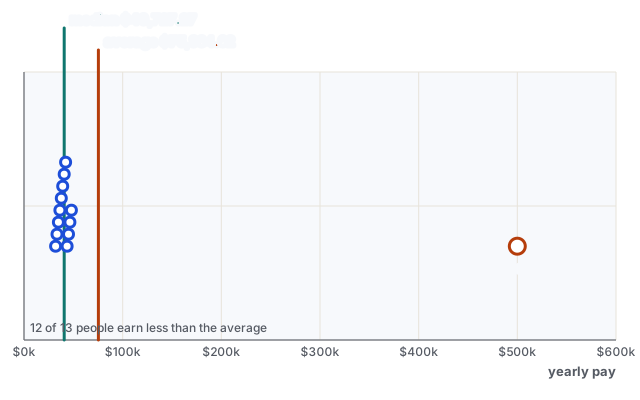
Mean vs. median: why one big paycheck skews the average
Add one huge salary and the average jumps. The median, the middle value, barely moves.
 Go further
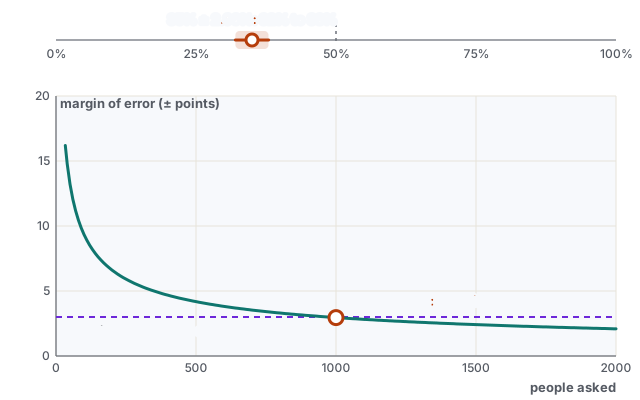
Poll margin of error: why about 1,000 people gives ±3%
The margin shrinks with the square root of the sample. Four times the people only halves it.
 Also try
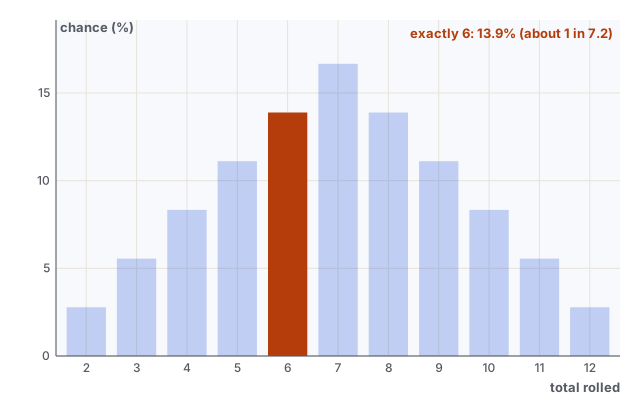
Dice odds: what are my chances of rolling it?
Why 7 shows up so often with two dice, and what that means for your next move.
Questions people ask
What is a z-score?
How many standard deviations a value is from the average. It lets you compare values from different scales, like a height and a test score.
What does the 90th percentile mean?
90% of values are below it. It says where you rank, not what share of questions you got right.
Is everything a bell curve?
No. Incomes and wait times are skewed, for example. The bell curve fits many measurements well near the middle but can be off far out in the tails.