Why is the median salary often lower than the average salary?
The mean adds everyone up and divides by the count, so one huge value pulls it up. The median is the middle value once everyone is sorted, so it barely moves. Nine people earning about $50,000 and one earning $1 million average $145,000, but the median is about $51,000.
- Average (mean) pay
- $75,384.62
- Median pay
- $40,727.27
- People earning less than the average
- 12
- Share of all pay going to the top earner
- 51%
When the average sits well above the median, a few large values are pulling it. That’s why incomes and home prices are usually reported as medians.
Challenge: With 20 or more staff, push the average to at least twice the median.
More settings
Play
Slide the top earner's pay from $60,000 up to $1 million and watch the two lines split.
Challenge: With 20 or more staff, push the average to at least twice the median. The box under the picture turns green when you get it.
Stuck? Pick one of the examples from the “Try an example” menu, or press “New example.”
Understand
There are two common ways to say "typical":
- The mean (average) adds everything up and divides by the count: .
- The median is the middle value after sorting.
For balanced data they agree. Add one very large value and the mean chases it, while the median stays with the crowd. On the graph, each dot is a person. Watch the two lines split.
Use
Every input has a unit menu, so you can type values in the units you already have. Results follow your units.
Show the work
- Mean: add everyone up, divide by the count
\bar x = \frac{980{,}000}{13} = 75{,}380 - Median: sort, then take the middle value
\text{middle of 13} = 40{,}730 - The gap is the pull of the top earner
\bar x - \text{median} = 34{,}660
Export
Slide the top earner's pay, and change the typical staff pay. "More settings" changes how many staff there are.
- Staff pay is spread evenly from 20% below to 20% above the typical pay, to keep the example simple.
For learning and estimation. Verify with applicable codes, standards, and a qualified professional before using in design, construction, or safety-critical work.
Cheat card
| Symbol | Meaning | Unit |
|---|---|---|
| mean (average) | ||
| how many values |
- With an even count, the median is the average of the two middle values.
- If the mean is well above the median, a few big values are pulling it.
- Incomes, home prices, and wealth are skewed, so reports use the median.
Where it’s used
- Finance & Business
Economists report median household income because a few very high earners distort the average. - Finance & Business
Real estate sites list median home prices so one mansion doesn’t skew a neighborhood. - Money & Shopping
Compare a job offer to the median pay for the role, not the average.
Related exhibits
 Start here
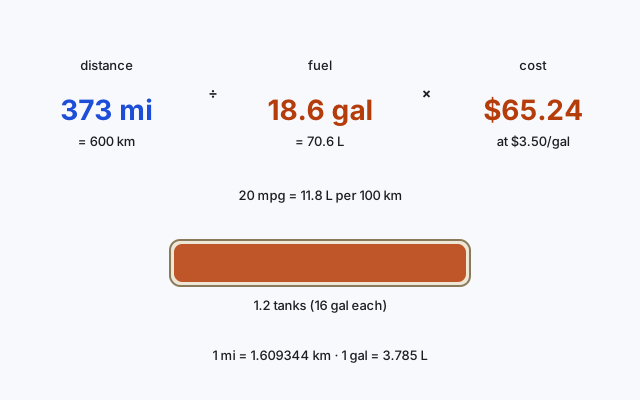
Road trip math: miles, liters, and dollars
Convert once and the trip adds up: how far, how much fuel, how much money.
 Start here
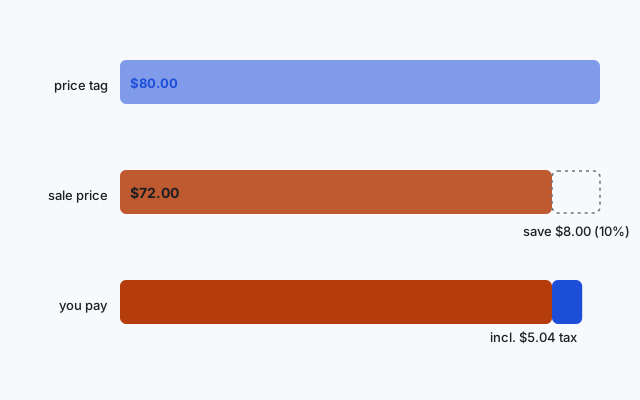
Sale price and tax: what you really pay
30% off, then tax on top. Percent math decides the number at the register.
 Go further
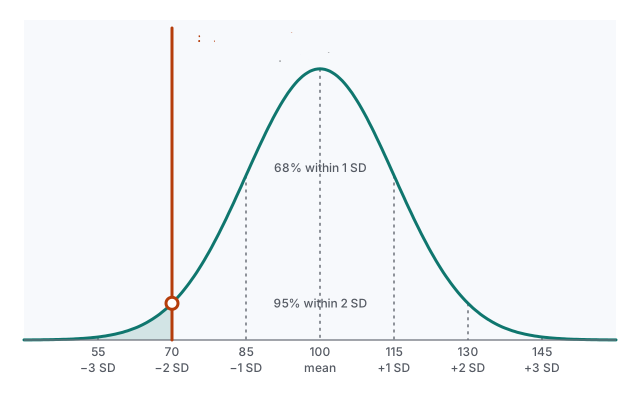
The bell curve: what percentile is that?
Count standard deviations from the average (the z-score), and the bell curve tells you what share falls below.
 Also try
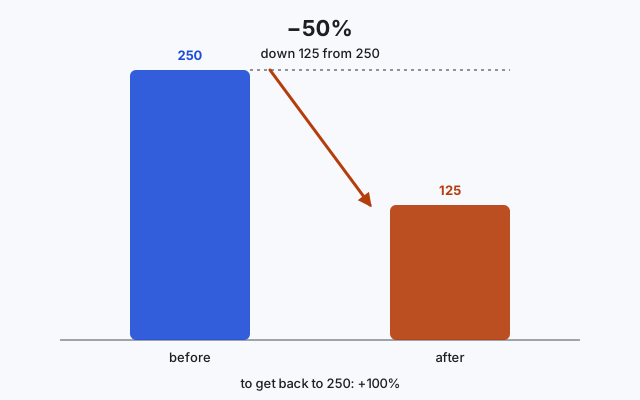
Percent change: up 50%, then down 50%, and you’ve lost money
A percent is always “of something.” Change the something and the same percent means a different amount.
Questions people ask
What's the difference between mean and median?
The mean is the total divided by the count. The median is the middle value when the numbers are sorted. They match for balanced data and split apart when a few values are extreme.
When should I use the median instead of the average?
When the data is skewed or has outliers, like incomes, home prices, or wait times. The median shows what a typical person sees.
What is an outlier?
A value far from the rest. One outlier can move the mean a lot, while the median hardly changes.