How do you get distance from a speed graph?
Distance is the area under the speed graph. At a steady speed that area is one rectangle: speed times time. When the speed changes, slice the time into thin strips and add up a rectangle for each. More strips get closer to the exact area. That exact area is the integral, the number the rectangles close in on.
- Rectangle total
- 240 m
- Exact distance (the integral)
- 320 m
- Error (how far off)
- 80 m
- Error as a share of the distance
- 25%
Challenge: On the car, sprinter, or bus graph, get within 1% of the exact distance using 8 rectangles or fewer.
Play
Pick a speed graph, then add rectangles and watch the error fall. Switch between left, right, and midpoint.
Challenge: On the car, sprinter, or bus graph, get within 1% of the exact distance using 8 rectangles or fewer. The box under the picture turns green when you get it.
Stuck? Pick one of the examples from the “Try an example” menu, or press “New example.”
Understand
At a steady speed, distance is speed × time. On a speed graph, that's the area of a rectangle: height times width.
When the speed changes, slice the time into strips of width . In each strip, pretend the speed holds steady, and use the height at the left end, the right end, or the middle. Adding the rectangles gives a Riemann sum:
More, thinner rectangles hug the curve more closely, and the total closes in on the exact area under the curve, the integral:
The small graph on the right shows the error for every number of rectangles from 1 to 50. It drops fast at first, then levels off near zero.
Use
Every input has a unit menu, so you can type values in the units you already have. Results follow your units.
Show the work
- Speed graph
v(t) = 0.03\,t(40 - t)\ \text{m/s} - Strip width
\Delta t = \frac{T}{n} = \frac{40}{2} = 20\ \text{s} - Add up the rectangles (height at the right-end of each strip)
\sum v(t_k)\,\Delta t = 12 \times 20 = 240\ \text{m} - Exact area: integrate
\int_0^{40} v(t)\,dt = \tfrac{2}{3} \times 12 \times 40 = 320\ \text{m} - Error
240 - 320 = -80\ \text{m}\ (25\%)
Export
Pick a speed graph, then set the number of rectangles and where each one takes its height.
- The exact distance comes from integrating each formula by hand, so it's exact, not another approximation.
- The error is the rectangle total minus the exact distance, shown as a size.
For learning and estimation. Verify with applicable codes, standards, and a qualified professional before using in design, construction, or safety-critical work.
Cheat card
| Symbol | Meaning | Unit |
|---|---|---|
| speed at time t | m/s | |
| length of the time span | s | |
| number of rectangles | ||
| width of each rectangle | s |
- When speed is rising, left ends fall short and right ends overshoot.
- Midpoints are usually much closer. Double the rectangles and a midpoint error drops to about a quarter.
- On a straight-line speed graph, midpoints are exact with any number of rectangles.
Where it’s used
- Physics
Displacement is the area under a velocity–time graph, and change in velocity is the area under an acceleration–time graph. - Mechanical
Engineers add up flow rate × time to find the total fuel burned or water pumped. - Driving & Travel
A car’s trip computer adds up speed × a tiny time step many times a second to count the distance. - Sports & Games
Coaches fit a speed curve to a sprinter’s split times to see where the race is won.
Related exhibits
 Start here
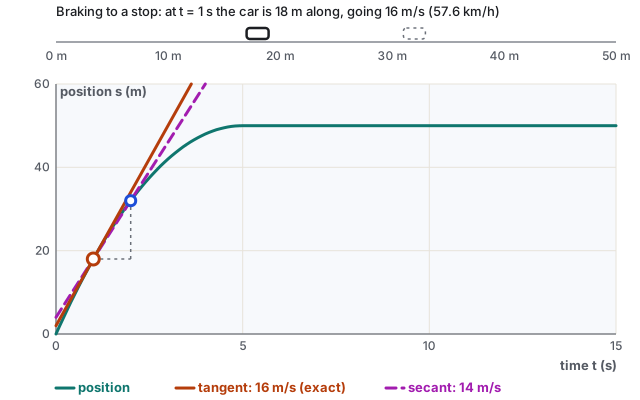
Speed from a position graph: the derivative
The steepness of a position graph is the speed. Shrink a secant line down to a tangent, and you have the derivative.
 Start here
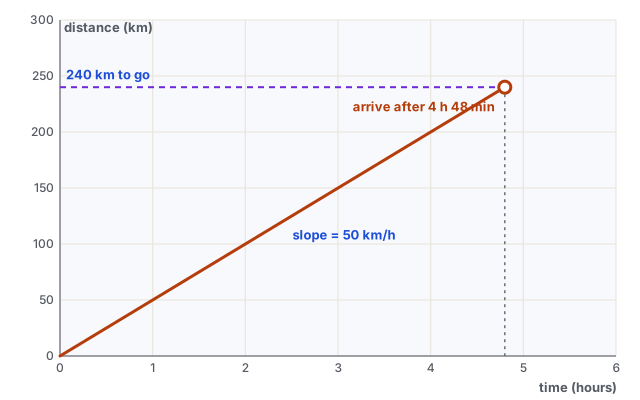
Speed, distance, time: how long is the drive?
Distance is speed times time. Rearrange it and you know when you’ll arrive.
 Go further
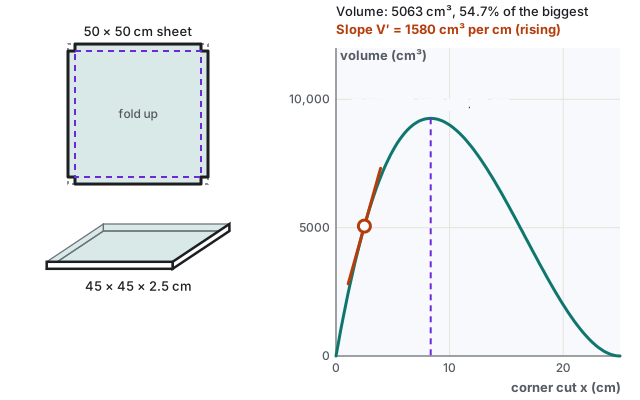
The biggest box from a sheet of cardboard: optimization
Cut a square from each corner and fold up the sides. Too small a cut makes a flat tray, too big a skinny tower. The derivative finds the best cut.
 Also try
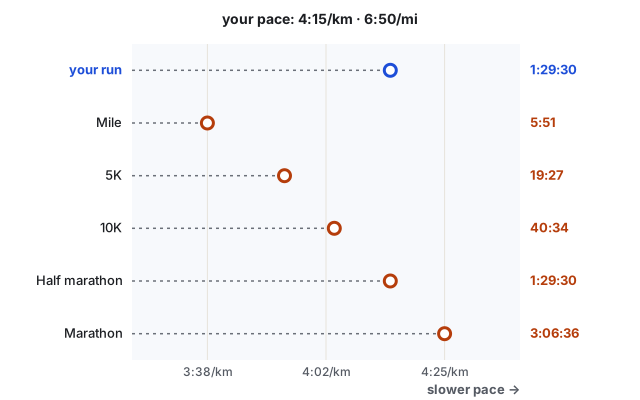
Running pace: from your 5K to a marathon time
Pace is a ratio. Predicting a longer race takes an exponent, because you slow down.
 Also try
E6B time and fuel: will it make it with a reserve?
Distance over groundspeed gives time; time times burn gives fuel. Then leave something in the tanks.
Questions people ask
Which is best, left, right, or midpoint?
Usually midpoint. When the speed keeps rising, left ends fall short and right ends overshoot, and midpoints land in between. On the car graph, 8 midpoint rectangles are off by 0.46%, while 8 left-end rectangles are off by 8.4%.
Why do left and right give the same total for the bus?
The bus graph is symmetric. It starts and ends at 0, so every left-end rectangle has a mirror-image right-end one. With 8 of either, the total is 315 m, against 320 m exact.
How long does the sprinter take for 100 m?
The area under this speed curve reaches 100 m at about 9.7 s, and 103.8 m by 10 s. The curve, 11.8(1 − e^(−t/1.2)) m/s, is a common simple model of a sprint.